
The debt capital market is divided into two parts – Public debt and Private debt. The Public debt comprises Govt securities (G-secs), State Development Loans (SDL), and Treasury bills while the Private debt market includes Corporate Bonds, Commercial Papers (CPs), and Certificate of Deposits (CDs). Here is the share of each type of fixed income securities in total outstanding amount (FY20):
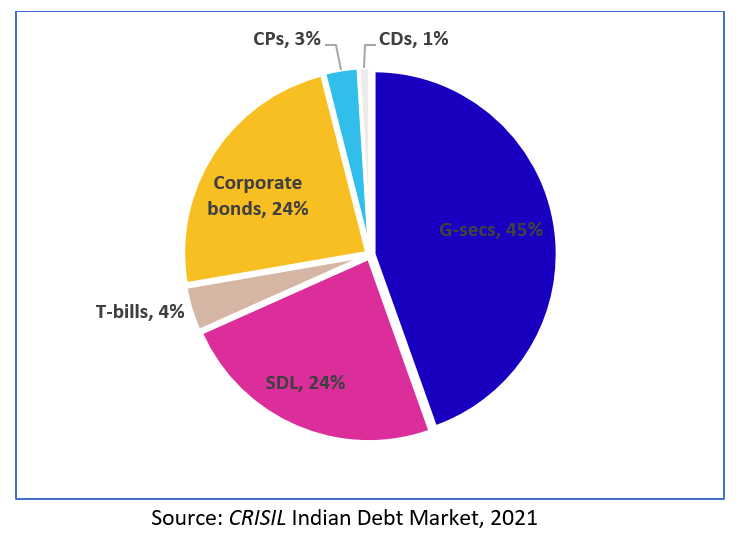
The Indian debt capital market is highly fragmented, both at the broader level and at the segment level. The overall market is dominated by sovereign bonds or g-secs, which account for ~30% of GDP in terms of issuances outstanding (FY20). The corporate bond market, on the other hand, accounts for ~16% of GDP. Despite being Asia’s third-largest economy, the size of India’s Corporate Bond market as a % of GDP stands closer to countries like Thailand and the Philippines.
There is a wide disparity within the Corporate Bond market as well. The investors’ appetite in the market is highly skewed towards higher-rated instruments (AA & above). Also, the share of issuances by top 10 players over total issuances have been scaling up since FY16 and rose to 50% in FY21 as COVID-19 has turned the situation unfavourable against smaller and low-rated issuers with a greater flight of capital towards safer instruments.
The disparity also makes it difficult for thousands of enterprises to access the debt market and leads to mispricing of their bonds. As evident from the issuances volume below, higher-rated (AAA and AA) issuers have been dominating the Corporate Bond market over the last decade.
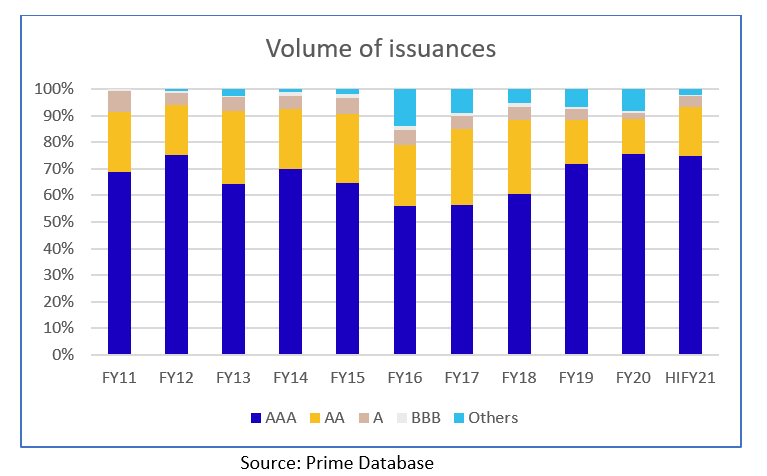
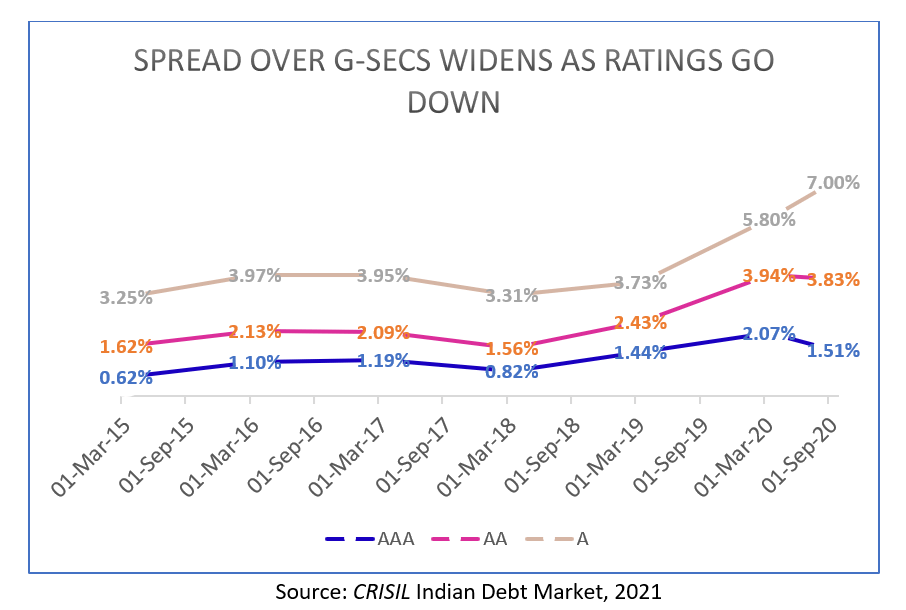
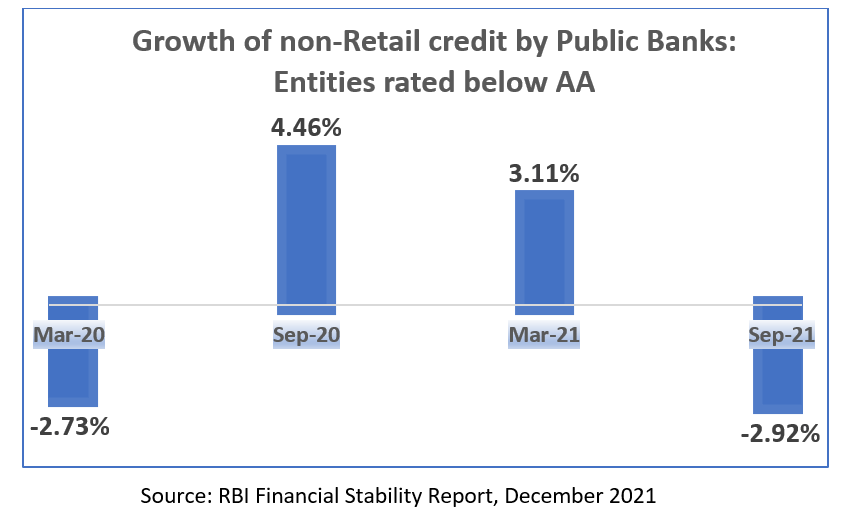
Given the volume and yield data, it is now clear that there are hardly any takers for below AA-rated bonds in the market. However, the mid-market corporates who have been issuing these bonds need capital to fund their growth plan. As the bond market is unable to fulfil their borrowing needs, the corporates turn to loan markets for funding. The problem has been exacerbated with a recovery in the economy after COVID as these corporates increasingly need to scale up their businesses.
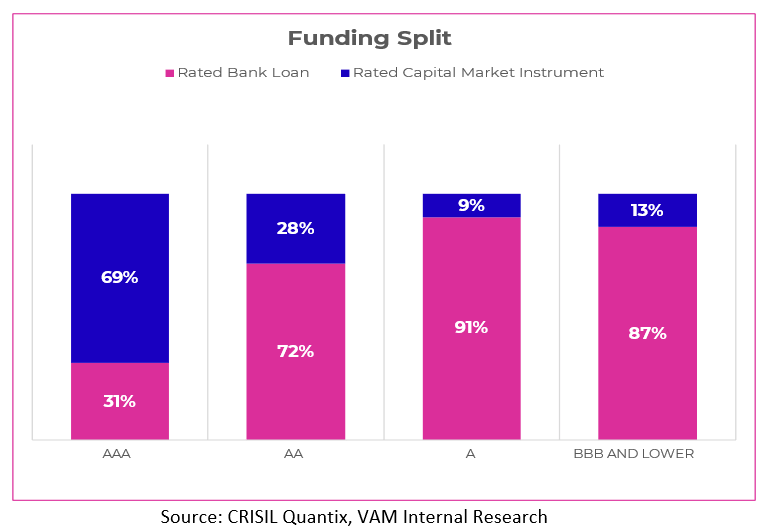
As the below chart suggests, the ratio of the bond market to bank loans became much lower over the last decade as we go down the rating curve from AAA to BBB and below. Unlike mature economies, mid to large corporates rated below AA are disproportionately reliant on loan markets, creating an asymmetry in the market.
Disclaimer:
The views provided in this blog are the personal views of the author and do not necessarily reflect the views of Vivriti. This article is intended for general information only and does not constitute any legal or other advice or suggestion. This article does not constitute an offer or an invitation to make an offer for any investment.